
OptiPower Ultra Series Batteries
Written by Justin Pucci
Here we are again with another long-winded review, from Justin! Sometimes I can be succinct…kind of. Nah, nevermind. You want to know about batteries, right? OptiPower batteries? Well, I’m going to tell you all about them, so just relax and enjoy. As always, I want to first say thank you to Andrew Hinton-Lever and Ben Varley from OptiPower UK for giving RCHN the opportunity to review their batteries! When the three of us first started the conversation about this review, we all instantly felt that it would make the most sense to combine it with my review of the Goblin Speed given how hard speed flying is on packs.
It turns out that there couldn’t have been a better way to do things, as flying 3D as a means to evaluate the capabilities of lipos isn’t ideal due to the extreme variability in flying styles. Furthermore, the same pilot may have difficulty doing the same exact flight routine back to back with different packs, thus skewing the results even further.
Product Description
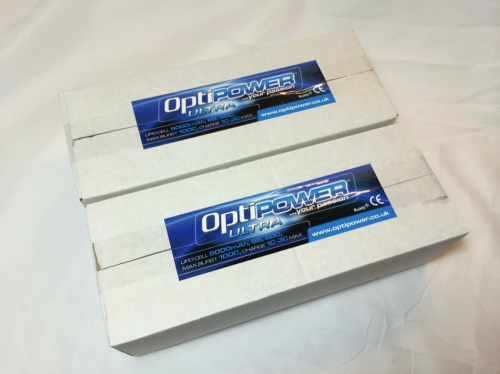
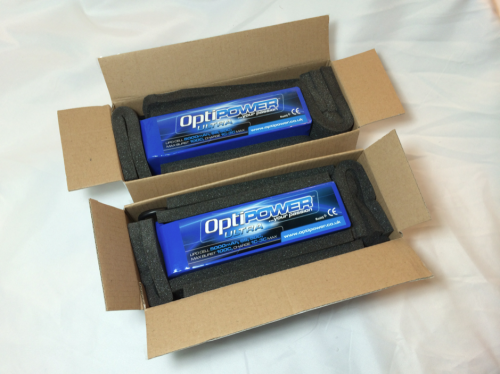
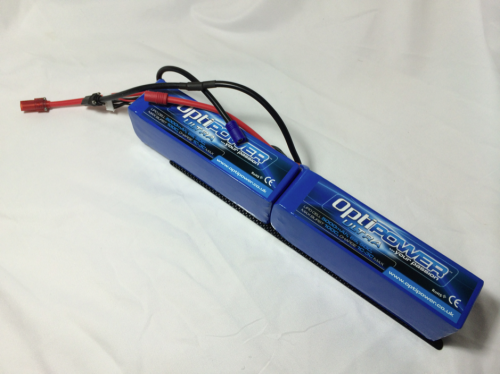
Before we get into the details, let’s talk about what we’re reviewing here. I was sent two OptiPower Ultra series batteries that are 5000mAh 6S 50C with a maximum burst of 100C and a charge rating of 1-3C. These are beautiful blue shrink-wrapped packs that come individually packaged in thick foam padding and a box. They measure 45x49x155mm, come with 10AWG wire, and weigh approximately 845g each.
My first impression when taking these out of the box was that they’re quite impressive packs in a couple of different ways. First off, they were both within 5 grams of each other on weight and they all had cells whose voltages were between 3.84V and 3.85V. Woot! No bad cells out of the box… Phew. That one has bit me more than once in the past with other brands.
The Testing
Ok, so why did it take me so long to complete this review? Well, what’s the point of doing a battery review if you don’t put cycles on the packs? I really wanted to make sure that I was able to provide objective data on the quality of these packs whether good or bad and that took a lot of flying. In fact, it took over 100 flights…114 to be exact! 😉
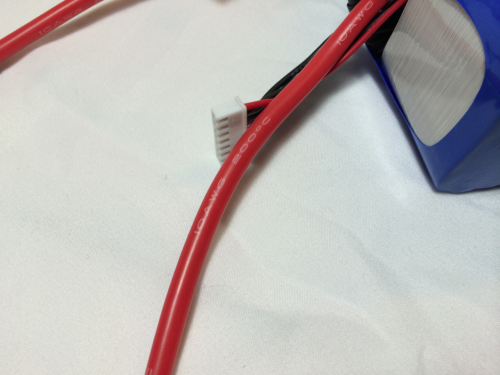
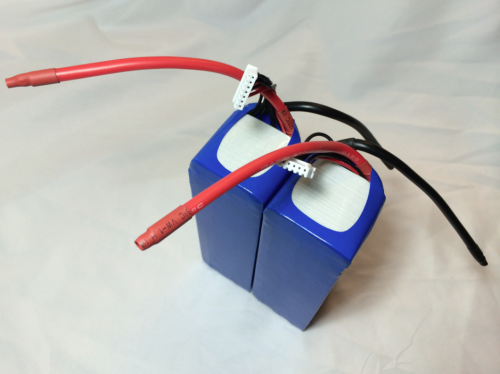
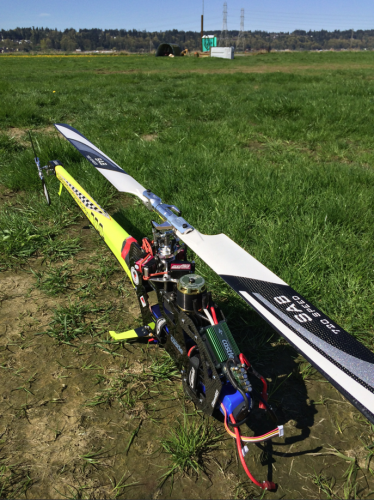
My testbed was the Goblin Speed during the speed review initially and then eventually I switched over to using them only on my Trex 700DFC and Goblin 770 for a 3D comparison. The packs were built in a stick configuration and used RCPROPLUS Supra-X 6mm bullets for the main power connections to the ESC and PRC6 6mm bullets for the series connections between packs. Both sets of connectors are rated at greater than 200A continuous.
The Goblin Speed was setup was a Castle Edge 160HV with a cap pack and a Scorpion HK4530-540LE motor running at up to 2600 rpm and 15 degrees of pitch and ESC and speed data was logged for EVERY flight. In addition to that, I logged data using my Dual PowerLab8 charger internal resistance (IR) function during charging of the batteries. As I eluded to before, a speed heli is an ideal platform because of the kind of load that’s put on the packs. We’re talking two to three minutes of high-current discharge speed runs in the range of 150A to 250A. That’s about as hard as it gets!
As for the 3D helis, the T-Rex 700DFC used a Scorpion 130A ESC, a Scorpion HK4526-520F3C motor, head speeds between 1700-2100 rpm, and 13 degrees of pitch and the Goblin 770 used a Scorpion 160A ESC, a Scorpion HK4530-450LE motor, head speeds between 1200-1700 rpm, and 13 degrees of pitch.
Alright, let’s talk a quick bit of theory…
Power is equal to current squared times resistance, right? So, if I want to know how much current I can support for a given power and resistance, I divide the power by the resistance and take the square root. Following?
P = I^2 * R, where P is power, I is current, and R is resistance.
I = (P / R)^1/2
Why do we care? Because in order to calculate what the apparent discharge or “C” rating of a battery is, you have to do this math. Over many years and many thousands of batteries of testing, the lipo industry has developed an empirical (or experimentally based) factor that I like to call the dissipation factor. What this represents is how much internal heat dissipation a given cell can endure before it becomes permanently compromised or damaged and no longer performs as intended.
For a typical lithium polymer cell, approximately 6W of heat dissipation for every 1Ah of capacity is the threshold of its capability. So, a 5Ah (5000mAh because there are 1000mA for ever 1A) pack can handle a total of 30W of dissipation before the chemistry and/or cell structure degrades permanently. When this happens, it manifests itself as softening or puffing of the cells.
Now that we know this, we can take an average cell IR measured from our charger or Equivalent Series Resistance (ESR) meter and calculate what it’s maximum discharge current is before it takes damage, which will give us the apparent C rating that pack!
Before we look at my actual data, let’s do an example. Take a 5000mAh pack whose cell IR averages 1 milliohm. First we figure out the maximum dissipation: 5Ah times the 6W/Ah dissipation factor is 30W.
Now we divide that by 1 milliohm (0.001 ohm) and get 30,000A squared. Taking the square root of 30,000A^2 gives you about 173A. Finally, divide that by the capacity of the pack and your apparent C rating is about 34.5!
Easy, right? Now the dissipation factor may vary a bit for different pack chemistries and state of the art technology, but as long as we use the same one on all calculations, we can at least compare two different packs in an apples-to-apples way. For instance, if you decided your dissipation factor was actually 7W/Ah instead of 6W/Ah, it would increase the apparent C rating by about 8%. Feel free to play with the math yourself and have fun, but remember to be consistent!
Results and Discussion
Alright, let’s jump right in… As I mentioned above, I measured IR using the Dual PowerLab. This was done every cycle for the first five break-in cycles on the bench and then every ten cycles after that. When you do this, you must make sure that you’re also consistent about the temperature at which the measurements are made. This is because the IR of a pack is very strongly dependent on temperature, so as long as you’re consistent (it’s a recurring theme, isn’t it?), then you’ll be able to do a valid comparison. My measurements were always done at pack temperature of 70F to 73F as measured with an infrared thermometer.
The OptiPower batteries were compared to what I’m going to refer to as “Brand X”…you know what else I fly, so feel free to draw your own conclusions. 😉
What’s the bottom line? Look at the plots I’ve made because they pretty much speak for themselves…
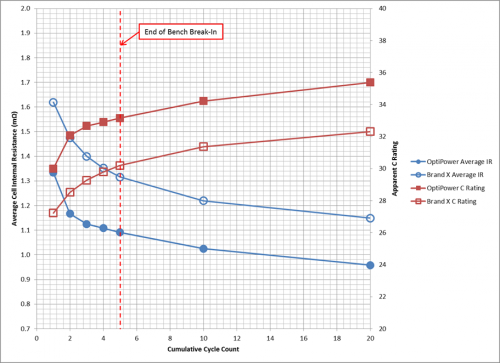
Let’s get acquainted with the graphs before we get too crazy here. I plotted average cell IR on the left vertical axis and with the blue circle symbols and apparent C rating on the right vertical axis and with the red square symbols. The OptiPower pack data is represented by the solid circles and squares while the Brand X data is given in open circles and squares. Also, note that there are two dotted red lines, which represent the end of my 5-cycle bench break-in and the end of my speed-flight testing, respectively.
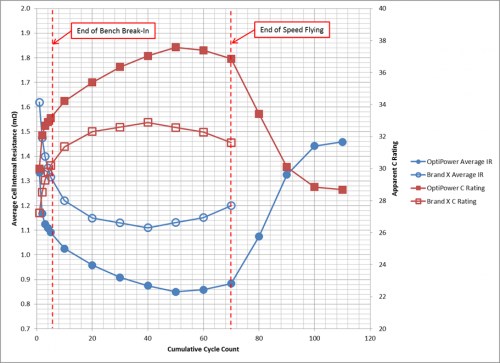
Instead of waxing philosophical on what the plots mean, I’m going to give it to you short and sweet. Here are the conclusions that I have drawn from my data:
1. Break-in makes a huge difference! I logged an 18% increase in C rating over the first five bench cycles on the OptiPower batteries. Both Brand X and the Opti’s were cycled five times with a 10A charge and 5A discharge from 4.2V to 3.8V and back to 4.2V per cell.
2. Compared to BrandX, the Opti’s saw a similar break-in characteristic, but with a lower overall resultant C rating.
3. The OptiPower apparent C rating peaked out with approximately 38C at around cycle #50 or #60 and began to decline slowly. At this point, I flew them for a bit more on the GS and then decided to retire them to the 3D helis. After flying them for a further 20 or so cycles, I observed a marked drop in apparent C rating to around 29-30C. Note that this is well after the peak C rating and was during mixed-load 3D flying, which may play a role in how the packs respond. In other words, once broken in, they may benefit from consistency of flying style rather than bouncing back and forth between different helis and styles. This would be worth another experiment though, as right now it’s only a partially-data driven speculation on my part…
4. BrandX peaked earlier at cycle #40 and tapered off earlier too. I’ve only logged about 75 cycles on BrandX though, so as you’ll see in the plots, I haven’t observed the same drop off that I saw on the Optis, but I fully expect to eventually.
5. Even after noticing the decline, the packs were noticeably better on my 3D helis than BrandX. This was especially noticeable on the Goblin 770 because of the extra load due to the Edge 753 blades.
See? I told you I could break it down nice and simply…kind of. 🙂 So, we peaked out at around 38C assuming a dissipation factor of 6W/Ah (it would be 41C if you assume 7W/Ah) and then hung out around 36-38 for several cycles. Ok, let’s talk real world now… The Opti’s can handle the speed loads much better than Brand X and this is very evident when you look at data from the ESC logs. The plot labeled “Speed #88” is an OptiPower battery run showing current in green and voltage in red and the plot labeled “Speed #87” is a Brand X run with the same color scheme.
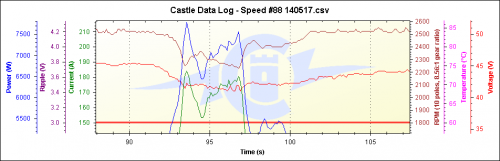
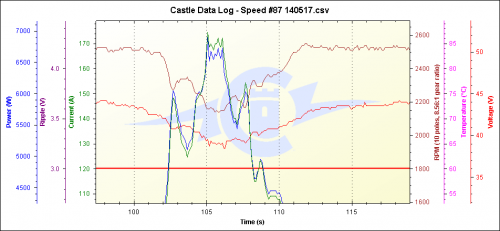
Notice from the plots above that under a 170-180A load, the OptiPower packs held around 43V while BrandX dropped all the way down to 39V. This means that my governed headspeed does not drop below the setpoint vakye as much on the Opti’s as compared to BrandX and this ultimately translates into higher speeds when the run is executed correctly. In fact, the Opti’s consistently posted 5 to 10 mph higher speeds on comparably clean runs. Also, my maximum speed of 155 mph was logged while using the OptiPower batteries! Woot! 😀
Conclusion
Let’s wrap this up. Most of you won’t be putting THIS much hurt to you packs because the vast majority of pilots out there are either sport or 3D pilots and, let’s face it, even the hardest of 3D smackers isn’t going to pull multiple-hundreds of amps for more than a few seconds at a time.
So, should we be worried if all we do is 3D? Nope, not at all! Your cycle life will likely be double or more given that even hardcore 3D loads are intermittent in nature compared to the constant beating that a speed pack takes. So, please don’t take my 60 or so cycles as an indication of what you should expect out of your batteries. Most speed packs only last that long, so this was completely expected.
Just remember that it’s not about what numbers the manufacturer puts on the side of their packs, it’s about how they ACTUALLY perform in real-world conditions and that ultimately means voltage sag under load. Also, remember that if you want to do similar testing for yourself, CONSISTENCY is the name of the game. Go back and read up on the key points just to make sure you’re ready to nerd out and then get to capturing that data!
Again, thank you to Andrew Hinton-Lever and Ben Varley of OptiPower UK for allowing me to review their awesome batteries! It was a wonderful experience and I can say with confidence that they’ll be sticking around in my 3D and speed fleets for good with this kind of performance! As always, thank you for reading and tuning in and if you have any questions, please feel free to email me at .
– Justin